
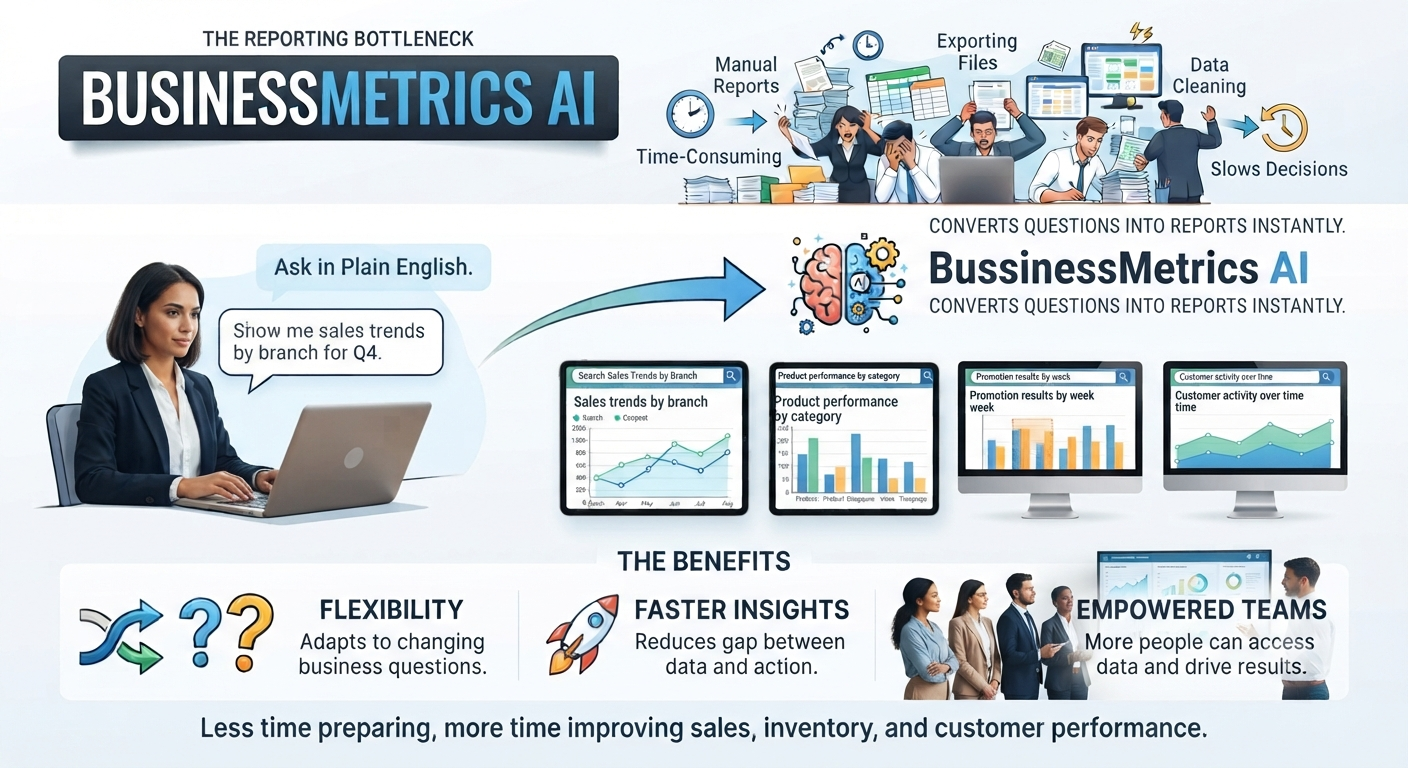
Many businesses already have the data they need, but turning that data into charts and reports still takes too much time. Teams often export files, clean spreadsheets, apply filters, and rebuild the same views again and again. That slows down decisions and makes reporting feel heavier than it should.
BusinessMetrics AI changes that by letting teams work in plain English. Instead of manually building every chart or report, users can ask for what they need directly. A manager might ask for sales trends by branch, product performance by category, promotion results by week, or customer activity over time. The system turns those requests into useful outputs faster.
This matters because business questions do not always arrive in a fixed format. Teams need flexibility. They need to move from “What happened last week?” to “Which product groups are slowing down?” without waiting for someone to redesign a report. Plain-English reporting makes that process much more practical for daily operations.
It also reduces the gap between data and action. When charts and reports are easier to generate, more people can use them, more questions can be answered, and decisions can be made with better visibility. For businesses already operating on POS data, that means less time preparing reports and more time improving sales, inventory, promotions, and customer performance.