
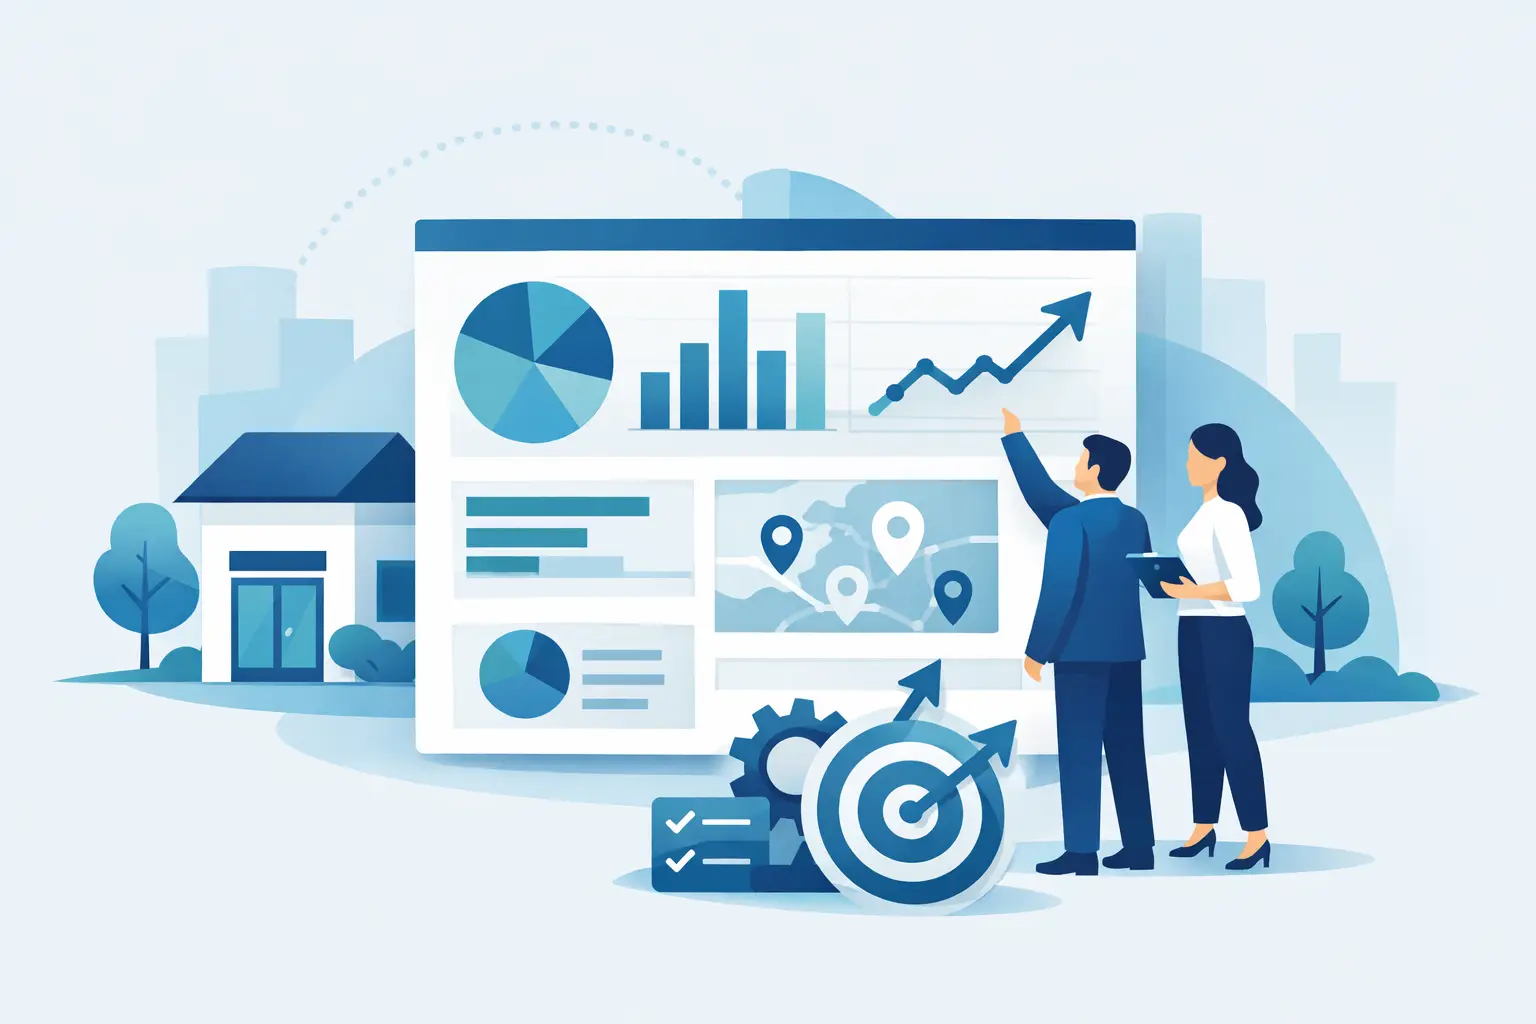
A weekly sales total can hide a lot. One branch may be growing because of discount-heavy promotions, another may be missing margin through stockouts, and a third may look stable while basket size quietly slips. That is why branch performance reporting matters. It gives multi-store retailers a way to compare locations on the measures that actually affect revenue, margin, labor efficiency, and day-to-day execution.
For operators running grocery stores, pharmacies, convenience stores, or general retail chains, the challenge usually is not lack of data. It is too much data spread across POS exports, inventory files, department reports, and promotion summaries. By the time someone combines those files, cleans them, and sends out a spreadsheet, the decision window has already narrowed. Store-level reporting needs to be faster than that.
What branch performance reporting should actually show
Good branch performance reporting does more than rank stores by sales. Sales are the starting point, not the answer. A branch bringing in high revenue may still be underperforming if its gross margin is low, if returns are high, or if sales depend on a narrow group of products that frequently go out of stock.
The useful view is a layered one. At the branch level, retailers need to see sales, margin, transaction count, average basket, units per transaction, discounts, refunds, and payment mix. Then they need enough detail to explain those results. Which departments are carrying the branch? Which categories are weakening? Are promotions lifting traffic or only reducing margin? Are inventory gaps hurting fast-moving items?
This is where many reporting setups fall short. They provide a branch P&L style snapshot but not the operating context behind it. Or they provide detailed transaction exports with no clear branch comparison. Retail teams need both. A regional manager wants to know which branch needs attention this week. A finance manager wants to know whether that branch issue is traffic, pricing, product mix, labor timing, or stock availability.
Why manual branch reporting breaks down
Manual reporting often works for a while, especially when a business has only a few stores. The problem starts when scale and reporting frequency increase. Every additional branch adds more files, more exceptions, and more chances for inconsistent logic.
One manager may define net sales differently from another. One report may exclude returns while another includes them. Product categories may be labeled inconsistently across stores. Promotional performance may be tracked in one file and ignored in another. The result is familiar to most retail operators: meetings spent debating whose numbers are right instead of deciding what to do next.
There is also a speed problem. If reporting depends on one analyst or one finance lead to prepare branch packs every week, insight becomes a bottleneck. When a store starts losing basket value or a promotion drives the wrong mix, a delayed report is more than an inconvenience. It means the issue can continue for days or weeks before someone acts.
The metrics that separate healthy branches from risky ones
Every retail model has its own priorities, so there is no universal scorecard. A pharmacy chain will watch different patterns than a convenience operator. Still, a few measures tend to reveal branch health quickly.
Sales trend is important, but it should be viewed alongside gross margin and discount rate. A branch can appear strong on top-line growth while slowly giving away profit. Transaction count and average basket work best together because they show whether growth is coming from more visits, higher spend per visit, or both.
Department and category contribution matter because branch weakness is rarely evenly distributed. A store may be underperforming because beverages are soft, front-end impulse items are down, or one high-volume department is carrying dead stock. Inventory indicators add another layer. If high-demand products are repeatedly unavailable, branch performance reporting should surface that before the issue shows up as a large monthly variance.
Promotion performance is another area where branch comparison matters. Some stores execute campaigns well and convert traffic into profitable sales. Others discount heavily with little lift. Looking at promotion impact by branch helps retailers distinguish a weak offer from weak execution.
How to make branch performance reporting useful
The best reporting systems reduce time to answer. They do not ask store teams or head office managers to build custom analysis every time a number moves.
That starts with structured inputs. If a retailer can export sales, inventory, product, customer, department, hourly sales, and promotion data in CSV or XLSX format, the reporting process should convert those files into a standard branch view without extensive manual rebuilding. Validation matters here because file issues create mistrust quickly. If the upload catches formatting errors early, users can move to analysis with more confidence.
The next requirement is dashboard design. A branch dashboard should make it easy to compare stores, filter by date range, and move from headline KPIs into category, product, and customer detail. Retail teams do not need dozens of charts. They need a small set of views that answer recurring operating questions quickly.
For example, a branch manager may ask why one location has lower sales than the rest of the region. A commercial manager may ask which categories are dragging that result. A finance lead may ask whether discounts or returns explain the gap. If the dashboard supports those paths, reporting becomes practical instead of performative.
Branch performance reporting and AI: where it helps
AI is useful in retail reporting when it removes steps, not when it adds complexity. Most operators do not want a data science project. They want to ask direct questions and get a clear answer backed by branch data.
That is where conversational analysis can improve branch performance reporting. Instead of exporting another file and writing formulas, a user can ask which branches had the sharpest drop in basket size this month, which promotions drove margin erosion, or which stores have the largest gap between sales growth and transaction growth. Those are operational questions. They should not require analyst support every time.
This approach is especially valuable for businesses that have data but limited BI capacity. A self-service platform like BusinessMetrics AI turns retail data uploads into dashboards and practical AI insights, which helps operators move from raw exports to branch-level decisions much faster. The value is not novelty. The value is cutting the time between seeing a problem and acting on it.
What good branch reporting changes in day-to-day operations
When branch reporting is clear and current, store reviews become more specific. Instead of telling a branch to improve sales, leaders can point to the actual issue. Maybe traffic is healthy but average basket is down. Maybe margin is being diluted by discounting. Maybe a category with strong demand is repeatedly out of stock during peak hours.
That changes accountability. Branch managers can focus on actions they control, such as stock availability, promotional execution, product placement, or staffing at high-traffic times. Head office teams can identify where support is needed instead of applying the same fix to every location.
It also improves planning. If one cluster of stores consistently outperforms in a category, that pattern can inform assortment and promotion strategy elsewhere. If a few branches show abnormal payment mix shifts or refund rates, those issues can be investigated before they become bigger control problems.
There is a trade-off, though. The more metrics a business tracks, the easier it is to lose focus. Reporting should be broad enough to explain branch results but narrow enough to support action. For most retail operators, fewer well-defined KPIs with clear drill-down paths work better than dense reporting packs full of measures no one uses.
Building a reporting process that scales with more stores
As branch counts grow, consistency becomes more valuable than customization. That does not mean every store should be judged in exactly the same way. Urban branches, neighborhood stores, and high-volume locations may have different patterns. But the reporting framework should still use common definitions so leaders can compare stores fairly.
A scalable setup usually includes standardized uploads, prebuilt dashboards for core retail views, and the ability to ask follow-up questions without waiting on a technical team. That matters for smaller chains as much as larger ones. In fact, growing retailers often feel the pain earlier because they have just enough complexity to need better reporting but not enough internal resources to maintain a custom BI stack.
Branch performance reporting works best when it is treated as an operating tool, not a board deck. If your team can spot weak stores, trace the cause to products, promotions, customers, or stock issues, and respond within the same reporting cycle, the numbers start doing what they should - guiding action at store level where performance is won or lost.