
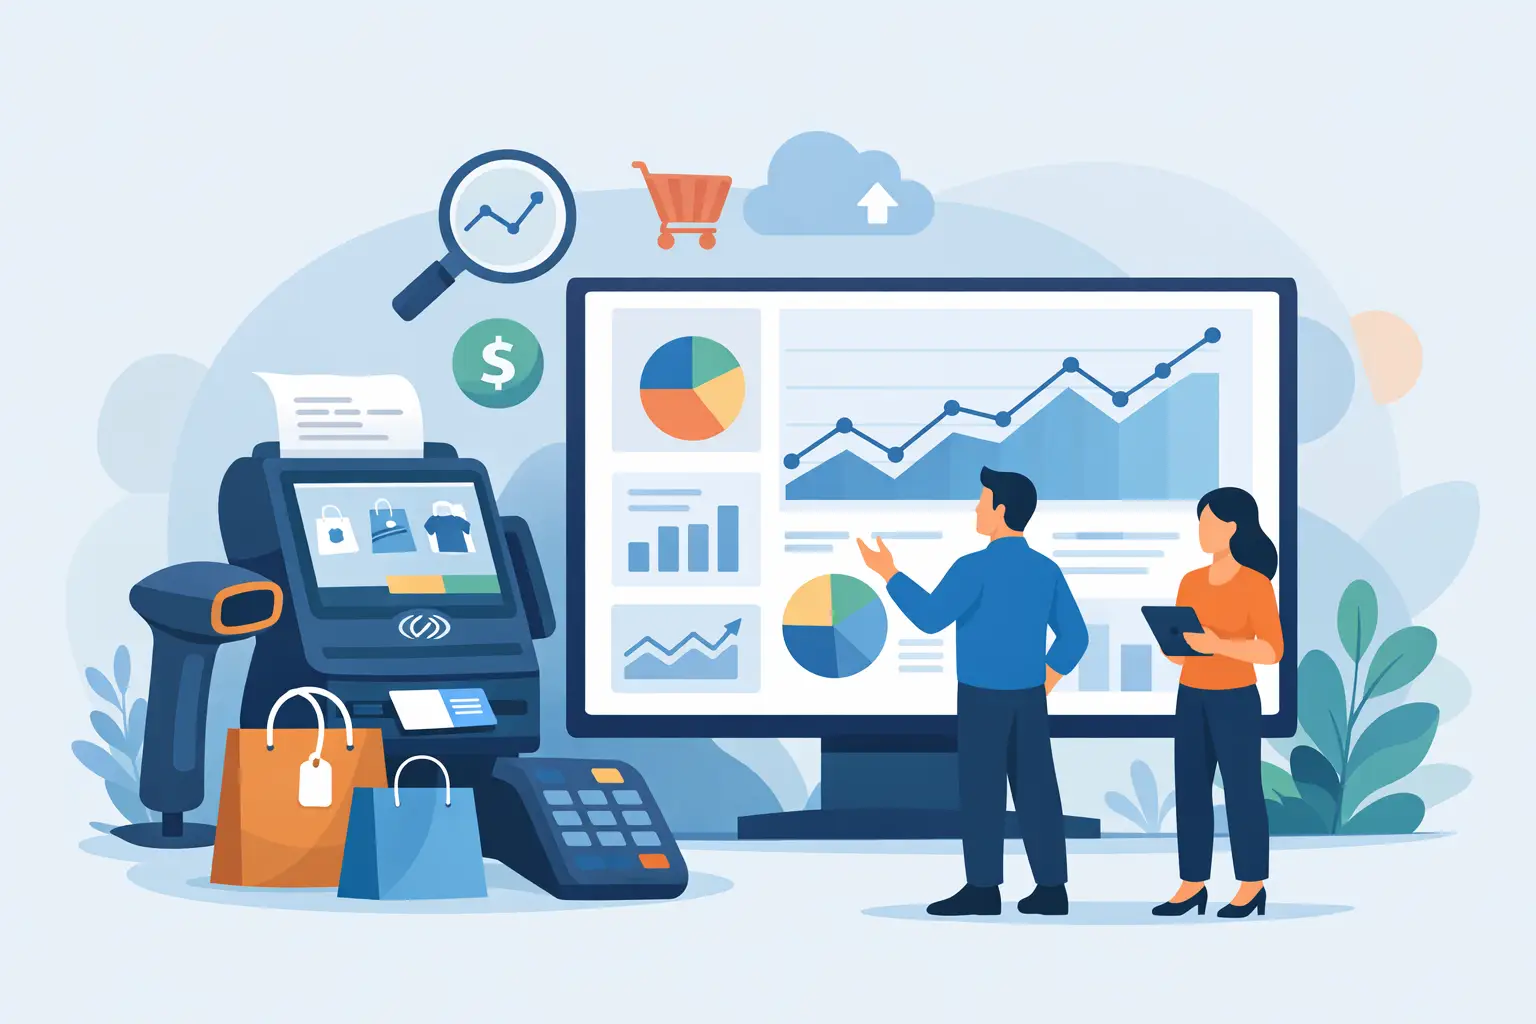
If your weekly reporting still depends on someone exporting POS files, cleaning columns, combining locations, and building the same charts again, the problem is not your team’s effort. It is the reporting process. POS data dashboard software exists to turn routine exports into usable visibility, so operators can see what is happening across stores, products, margins, and customer activity without rebuilding reports every time.
For many retailers, that gap shows up in ordinary but costly ways. A branch misses plan for three weeks before anyone spots the pattern. A promotion looks busy at the register but weak on margin. A product category appears healthy in total sales while one store is quietly losing units and another is carrying too much stock. Raw POS exports contain the signal, but getting to that signal often takes too long.
What POS data dashboard software should actually do
At a basic level, this software takes structured point-of-sale data and turns it into dashboards. But that definition is too broad to be useful. Generic BI tools can do that too, at least in theory. What matters is whether the software is designed around how retail teams work.
Retail operators do not need a blank canvas. They need a faster path from exported files to answers. That usually means support for CSV and XLSX uploads, validation of incoming data, and prebuilt dashboard logic for the metrics retailers already track. Sales by branch, department performance, hourly sales, payment mix, product movement, customer summaries, and promotion results should not require custom modeling every month.
The best POS data dashboard software also reduces dependence on technical staff. If every new question requires an analyst, a consultant, or a BI developer, the software may be powerful but it is not operationally efficient. Store groups need something managers can use directly, especially when decisions have to be made during the week, not after the month closes.
Why retail teams outgrow spreadsheets and generic BI
Spreadsheets remain useful, but they become fragile as store count, transaction volume, and reporting frequency grow. A single-store operator can often work around that. A five-store or twenty-store chain usually cannot. As soon as different exports, different managers, and different reporting versions enter the process, consistency starts to break down.
Generic BI platforms solve part of the problem, but they introduce another one. They often assume you have the time and internal skill to define data models, build visuals, manage permissions, and maintain logic over time. Some retailers do. Many do not. That is especially true in grocery, convenience, pharmacy, and other fast-moving formats where finance and operations teams are already stretched.
This is where retail-specific dashboard software becomes a practical option. Instead of asking users to design analytics from scratch, it starts with common retail use cases and shortens the path to visibility. That is not a small difference. It changes how quickly the business can respond.
The operational questions that matter most
A good dashboard is not just a prettier report. It should help answer the questions retail teams ask every week.
Which branches are underperforming against recent trends? Which categories are driving sales but weakening gross profit? Which products sell well in one location and stall in another? Are certain hours overstaffed relative to sales? Did a promotion increase basket value or simply shift demand from full-price items? Is cash, card, or another payment method changing in a way that affects operations?
These are not advanced analytics questions. They are routine management questions. The issue is that routine questions become slow and expensive when the data sits in disconnected exports. Software that can convert POS data into usable dashboards and natural-language answers closes that gap.
What to look for in POS data dashboard software
The first priority is data readiness. Retail businesses rarely have perfect exports. File structures change, column names vary, and some stores follow cleaner processes than others. Software should help validate uploaded files before they distort the dashboard. If data quality problems are hidden, reporting becomes less trustworthy, not more.
The second priority is prebuilt retail views. A platform should already understand the difference between store performance, product performance, customer summaries, inventory movement, department sales, hourly trends, and promotion results. If those views need to be custom-built from scratch, setup time grows and adoption slows.
The third priority is ease of use. This matters more than feature count for most retail teams. If a branch manager, finance lead, or commercial manager cannot quickly find the answer, the dashboard becomes a monthly reference tool instead of a daily decision tool. Search, filtering, clean metric definitions, and plain-language interaction all matter here.
A fourth requirement is scalability by branch. Many retailers are not buying software for a nationwide rollout on day one. They want to start with a manageable footprint, prove value, and add more stores over time. Pricing and deployment should fit that reality.
Where AI adds value and where it does not
AI in retail analytics is useful when it removes reporting friction. It is less useful when it adds another layer of complexity or produces vague commentary. The practical use case is simple: let users ask direct business questions in natural language and get a clear answer based on their uploaded data.
For example, a manager should be able to ask which branches had the sharpest drop in beverage sales last month, which products had strong revenue but declining unit velocity, or which promotions improved sales without harming margin. That saves time because the user does not have to build a custom report first.
There is a trade-off, though. AI outputs are only as useful as the underlying data structure and metric logic. If the upload process is inconsistent or the business has not aligned on definitions, AI can surface answers faster, but not necessarily better. That is why the combination of file validation, retail-specific dashboards, and AI querying matters more than AI alone.
A better workflow for multi-store reporting
The real value of POS dashboard software shows up in the workflow. Instead of exporting files, emailing versions around, adjusting formulas, and waiting for someone to interpret the results, the team uploads structured files and works from a common view.
That shift improves speed, but it also improves control. Finance can check revenue, margin, and tender mix without rebuilding the same monthly pack. Operations can compare branch performance and spot weak hours or categories earlier. Commercial teams can review promotions and product trends without asking for a custom cut of the data.
For growing retailers, this matters because delay carries a cost. If a store is slipping, if shrink is rising, or if a high-volume category is losing profitability, finding out two or three weeks later narrows your options. Timely visibility is not just convenient reporting. It is a management advantage.
When the software is the right fit
POS data dashboard software is usually the right fit when a retailer already exports structured data from its POS or related systems and needs faster reporting without a major BI project. It is especially useful for operators with multiple branches, recurring weekly or monthly reporting cycles, and limited internal analytics resources.
It may be less useful if the business lacks clean exports entirely or needs highly customized enterprise data architecture before reporting can begin. In those cases, foundational data work may come first. But many retail businesses are not starting from zero. They already have the files. What they lack is a fast, dependable way to convert those files into operational insight.
That is why solutions built for retail workflows stand out. A platform like BusinessMetrics AI is designed around that specific need: upload structured POS and operational files, validate them, generate retail dashboards, and ask practical business questions in plain language. The value is not theoretical. It is measured in hours saved, faster visibility, and better decisions across branches.
The strongest software in this category does not promise magic. It gives retail teams a clearer line of sight into what needs attention now, while keeping reporting simple enough to use every week. If your data is already leaving the POS system, the next step is making sure it arrives somewhere that helps you act on it.