
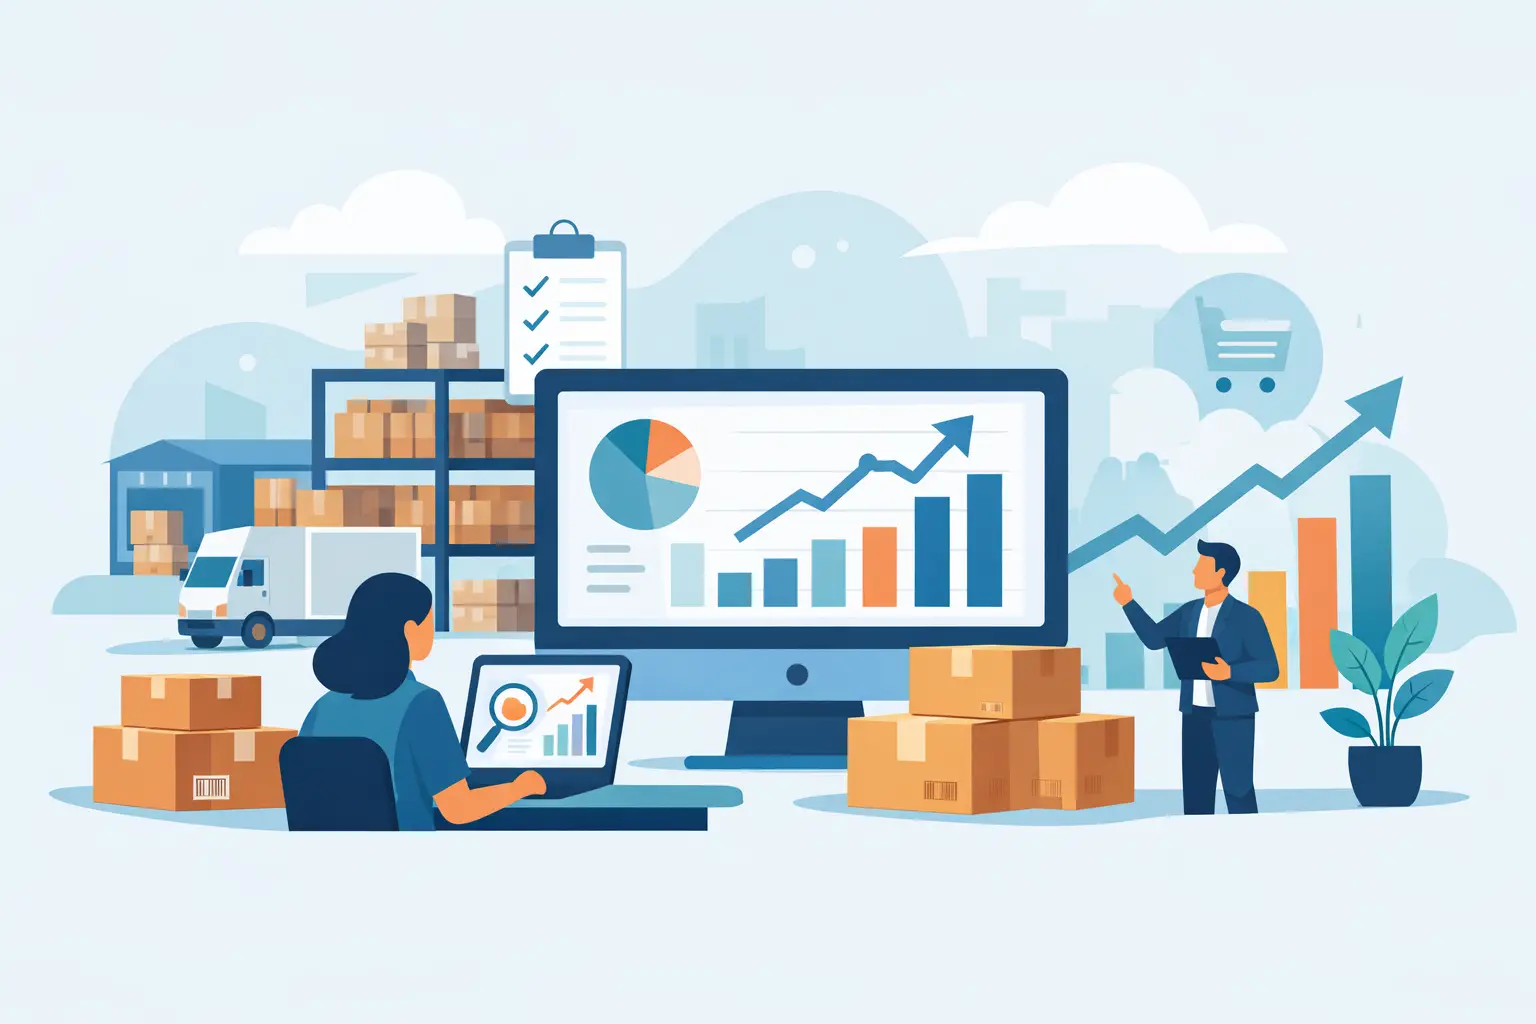
A store can look busy all week and still lose margin quietly through inventory mistakes. The problem is rarely a lack of data. Most retailers already have sales files, stock records, item movement, and branch-level reports sitting in their POS or back-office systems. The gap is turning that raw data into answers fast enough to act. That is where inventory analytics software earns its place.
For multi-store retailers, inventory decisions affect cash flow, fill rate, waste, customer satisfaction, and promotion performance at the same time. If one branch is overstocked while another is missing top sellers, the issue is not just operational. It becomes a revenue problem, a margin problem, and often a reporting problem too. Good analytics software helps teams see those patterns early, without waiting for someone to build a custom spreadsheet at the end of the month.
What inventory analytics software should actually do
A lot of tools claim to help with inventory, but the practical question is simple: can the system show what needs attention today, by store, by category, and by product? Retail teams do not need another layer of complexity. They need visibility that connects stock movement to business outcomes.
At a minimum, inventory analytics software should bring together sales history, current stock position, product performance, and branch-level trends. That gives operators a clearer view of which items are selling through as expected, which products are sitting too long, and where stockouts are likely to hurt revenue. It should also help users move from a dashboard to a decision quickly. If a category is underperforming, the next question is whether the issue is demand, pricing, range mix, or stock availability.
That matters even more in grocery, pharmacy, convenience, and general retail environments where product velocity changes fast. A weekly report may tell you what happened. Analytics should tell you where to look next.
Why spreadsheets stop working
Spreadsheets are familiar, flexible, and cheap. They are also one of the main reasons inventory analysis becomes slow and inconsistent as a retail business grows. When data comes from multiple stores, multiple file exports, and multiple people updating reports, version control starts to break down. Definitions drift. Formulas get copied incorrectly. Teams spend more time preparing reports than using them.
The bigger issue is speed. If a commercial manager wants to know which branches are repeatedly running out of promoted products, that answer should not depend on one analyst with the right spreadsheet template. If a finance lead wants to see inventory exposure by category across all locations, it should not require a manual file merge every Monday.
This is where purpose-built retail analytics tools make a real difference. They reduce report preparation time and make inventory performance easier to review in a consistent format across stores. That consistency matters because it lets managers compare branches fairly, not through slightly different local reports.
The metrics that matter most
Retailers can track dozens of inventory metrics, but not all of them deserve equal attention. The right software should focus users on measures that lead to action.
Stockout rate is one of the most obvious. If high-demand items are unavailable too often, sales are being lost whether or not that loss is fully visible in the POS data. Sell-through rate is equally useful because it shows whether stock is moving at the expected pace. Slow sell-through may point to overbuying, weak assortment decisions, poor placement, or pricing problems.
Inventory turnover remains a core metric because it connects stock levels to actual movement. Higher turnover is not always better, especially if it causes service issues, but very low turnover often means cash is sitting in the wrong products. Gross margin return on inventory investment can also help, particularly for managers balancing volume with profitability. An item can sell often and still tie up too much capital for the margin it delivers.
Then there are operational indicators that matter at branch level: days of stock on hand, dead stock, category fill gaps, and promotion-linked stock performance. These are the numbers that help local teams take action instead of just observing trends.
What good inventory analytics software looks like in practice
The most useful systems are not the ones with the most charts. They are the ones that turn exported retail data into dashboards people can use without technical support. That usually starts with a structured data workflow. If your team can export CSV or XLSX files from POS and operational systems, the software should validate those files, map them into retail reporting, and surface issues clearly.
From there, the platform should present inventory performance in the same context as sales, branches, products, customers, and promotions. Inventory rarely makes sense in isolation. If one product line is overstocked, managers need to see whether sales slowed, whether a campaign underperformed, or whether the issue is concentrated in specific stores.
This is also where natural-language querying becomes useful. A retail operator should be able to ask direct questions such as which branches have the highest stock exposure in slow-moving items, which categories are losing sales due to repeated stockouts, or which products need replenishment review after a promotion. That shortens the path from data to action and reduces dependence on BI specialists.
Inventory analytics software and branch performance
For single-store businesses, inventory visibility is already valuable. For multi-branch retailers, it becomes essential. Central teams need to know whether issues are isolated or systemic. One branch may be carrying too much stock because local demand is weak. Another may be understocked because replenishment assumptions were based on outdated sales patterns.
Without branch-level analytics, those differences get buried inside aggregate totals. Overall inventory may look acceptable while individual stores struggle with empty shelves or excess backroom stock. The software should make branch comparisons easy, with clear views into top and bottom performers, unusual variances, and exceptions that need attention.
This is one of the strongest use cases for a self-service platform. Store operators and area managers can review the same numbers without waiting for custom reports. That supports faster intervention, especially when issues are recurring and operational rather than strategic.
Choosing the right tool for your retail business
Not every business needs a large enterprise inventory platform. In many cases, retailers already have the core data they need. What they lack is a faster way to turn exports from existing systems into practical reporting and AI-assisted analysis.
When evaluating software, it helps to ask a few direct questions. Can it handle the data formats your team already exports? Does it provide dashboards built for retail rather than generic BI templates? Can non-technical users answer day-to-day questions without asking an analyst? Does it show inventory in relation to sales, departments, promotions, and branch performance? And just as important, can it support growth without forcing a complex implementation project?
There are trade-offs. Some tools go deeper into forecasting and supply chain planning, which may be useful for larger operations with dedicated teams. Others are better suited to fast visibility and operational reporting. It depends on your retail model, your data quality, and how quickly your team needs to act. For many operators, the immediate win is not perfect prediction. It is consistent visibility into where stock is helping the business and where it is hurting it.
Where retailers see value fastest
The quickest gains usually come from reducing reporting delays and making exceptions easier to spot. That might mean identifying products with repeated stockouts, finding categories with excess stock relative to demand, or comparing stores that should perform similarly but do not. Once those patterns are visible, teams can adjust purchasing, replenishment, assortment, or promotions with more confidence.
This is why platforms like BusinessMetrics AI resonate with growing retailers. The value is not theoretical. It comes from taking familiar exports from POS and operational systems, turning them into dashboards quickly, and letting users ask practical questions in plain language. That approach fits businesses that need control and speed more than another long analytics rollout.
Inventory will always involve judgment. Weather changes demand. Promotions distort patterns. New stores behave differently from mature ones. Software does not remove that complexity. What it should do is give decision-makers a clearer starting point, so they can act earlier, with fewer blind spots.
If your inventory reporting still depends on manual spreadsheets and delayed branch updates, the issue is no longer just efficiency. It is visibility. And in retail, visibility is often the difference between protecting margin and explaining later where it went.