
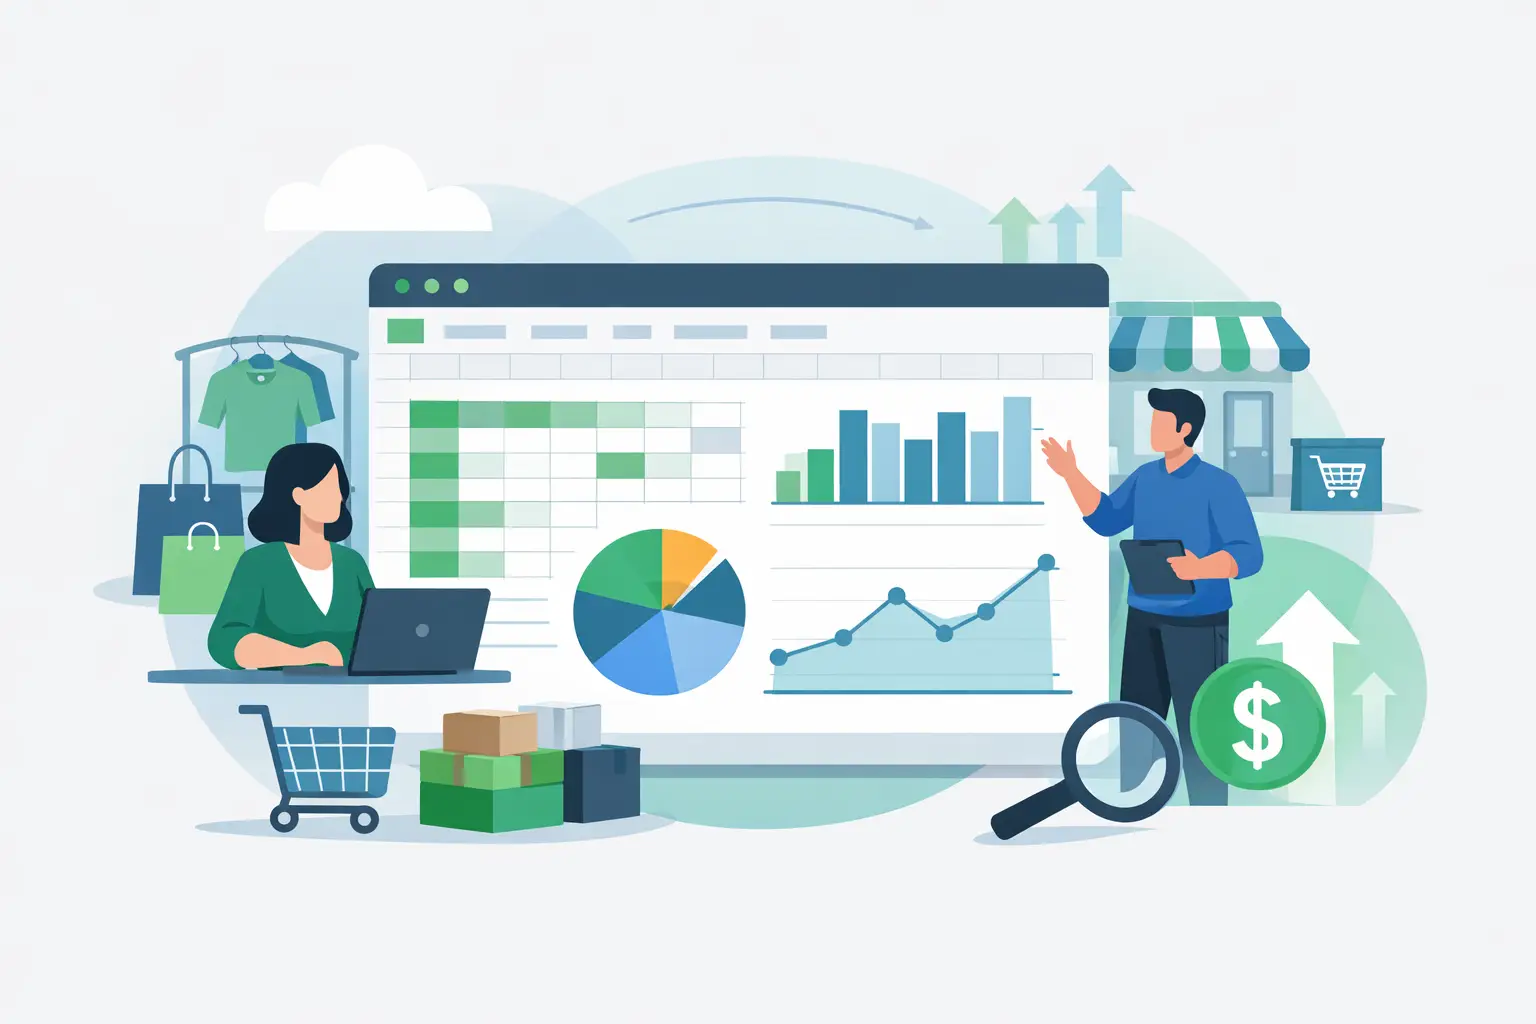
If your weekly sales review still starts with downloading spreadsheets, fixing column names, and stitching together branch files, the real problem is not reporting discipline. It is the lack of an xlsx sales dashboard tool built for how retail data actually shows up - exported from POS systems, spread across stores, and needed fast by people running the business.
Retail operators do not need another generic BI setup that assumes clean warehouse data and an analyst on standby. They need a system that accepts structured XLSX exports, validates them, and turns them into dashboards that answer practical questions. Which store is slowing down? Which category is losing margin? Which promotion lifted units without improving profit? Those are operating questions, not data science projects.
What an xlsx sales dashboard tool should actually do
A useful xlsx sales dashboard tool does more than visualize rows and columns. It should take the files your POS or back-office systems already produce and convert them into a reporting layer that is ready for day-to-day decisions.
For retail teams, that usually means handling sales by branch, SKU or product group performance, customer summaries, payment mix, hourly sales, inventory signals, and promotion results. If the tool only gives you charts without structure, you still end up doing manual prep work before the dashboard becomes usable.
That is where many spreadsheet-based workflows break down. Teams often believe they already have reporting because they can export XLSX files. But exported data is only a starting point. Someone still has to check whether fields match, whether dates are consistent, whether branch names are duplicated, and whether sales are being interpreted the same way every week. A dashboard tool earns its place when it removes that recurring friction.
Why XLSX matters in retail operations
Retail businesses rarely operate from a single perfect data source. A grocery group may pull one file from the POS, another from inventory, and a third from promotions. A pharmacy chain may receive branch-level exports from separate systems depending on store age or franchise model. In many cases, XLSX is the common format because it is what teams can access immediately.
That makes XLSX support more than a convenience feature. It is often the only realistic path to self-service reporting. If a platform requires database integrations before it can show useful sales dashboards, smaller and mid-sized operators may never get started.
There is a trade-off here. XLSX-based reporting is fast and practical, but it depends on file quality and consistency. If exports change structure every week, even a good tool will need rules and validation to keep reporting reliable. The best platforms handle this by checking uploads before they hit dashboards, so users know whether data is complete and usable.
Generic dashboard software vs a retail-specific xlsx sales dashboard tool
Generic BI software can certainly read spreadsheet files. The issue is not whether it can ingest XLSX. The issue is how much work your team must do after the upload.
In a generic environment, sales fields need mapping, retail metrics often need custom calculations, and dashboards usually have to be built from scratch. That may be acceptable for companies with analysts and time. It is less helpful for operators who need branch comparisons before the next management call.
A retail-specific xlsx sales dashboard tool starts from the assumption that users want immediate visibility into store performance. Instead of asking a manager to design visualizations, it should provide prebuilt dashboards around the questions retail teams already ask. Sales by branch, top and bottom products, customer value trends, promotion impact, stock pressure, and hourly trading patterns are not edge cases. They are standard operating views.
This is the difference between software that can analyze retail data and software that is built for retail reporting. One gives you components. The other gives you answers.
What good reporting looks like after the upload
Once files are uploaded, the dashboard experience should feel straightforward. Managers should be able to see whether total sales are moving in the right direction, which branches are ahead or behind, and where mix changes are affecting margin. Finance teams should be able to check performance without rebuilding pivot tables. Commercial teams should be able to spot underperforming categories or promotions quickly.
The strongest tools also move beyond static dashboards. They let users ask direct questions in plain language, based on the uploaded sales data. That matters because many retail decisions start with a follow-up question, not a chart. A branch underperformed, but was the issue traffic, average basket, category mix, or a stock gap? A promotion increased unit sales, but did it shift purchases from higher-margin items? Dashboards point to a pattern. Natural-language querying helps explain it.
For teams without dedicated analysts, that gap is significant. It reduces the delay between seeing a problem and understanding it.
The metrics retail teams usually need first
Most operators do not need hundreds of KPIs on day one. They need a short list of reliable views they can trust across branches.
Sales trend reporting is the starting point, but by itself it is not enough. Branch comparison matters because total growth can hide weak execution in individual stores. Product and category reporting matters because volume gains may come from the wrong mix. Customer summaries matter because repeat value often tells a different story than topline sales. Payment mix matters because it affects cash handling, fees, and store behavior. Hourly sales patterns matter because labor decisions depend on them.
Promotion reporting is another area where a purpose-built XLSX workflow helps. Promotions often look successful when measured on units alone. A better dashboard shows whether they improved revenue quality, increased basket size, or simply discounted demand that would have happened anyway.
Inventory signals also belong in the same environment, even if they come from separate exports. Sales and stock should not live in different reporting worlds if the goal is operational action.
What to look for when choosing the tool
If you are evaluating options, start with the workflow rather than the visuals. A polished chart does not matter if every upload requires cleanup from finance or IT.
Look for file validation first. The platform should tell you whether your XLSX file structure is usable and where issues exist. Next, check whether dashboards are prebuilt for retail use cases instead of requiring manual model design. Then look at how quickly users can move from upload to insight. If setup takes weeks, the process is too heavy for most store-led teams.
It also helps to check whether the tool supports multi-branch scaling without forcing a full enterprise implementation. Many retailers need to start with a subset of stores, prove value, and expand. Software that matches that path is usually a better operational fit than software designed for massive centralized BI programs.
Finally, test the questioning layer. If the tool includes AI, the AI should help users interrogate actual business performance, not generate vague commentary. Useful questions sound like this: which branches declined week over week, which categories are dragging margin, which customers increased spend, and which products need attention due to low sell-through and growing stock.
Where this approach fits best
An xlsx sales dashboard tool is especially useful for retail businesses that already export structured data but are stuck in manual reporting loops. That includes convenience store groups, mini marts, grocery operators, pharmacies, and general retail chains with multiple outlets and limited internal BI capacity.
It is less useful if your business lacks consistent exports altogether or if every location tracks data differently with no standard structure. In that case, the first step is data discipline. But many operators are closer than they think. They already have the files. What they lack is a system that turns those files into decision-ready reporting without extra layers of spreadsheet work.
That is why tools in this category are gaining traction. They meet retail teams where they are. Instead of asking operators to become BI specialists, they turn routine XLSX exports into dashboards and usable answers. BusinessMetrics AI follows that model by combining file validation, retail-ready dashboards, and conversational querying in one workflow focused on store performance.
For retail leaders, the value is simple. The faster you can trust the numbers, the faster you can act on them. And when reporting starts with the files you already have, better visibility becomes a practical operating upgrade rather than another delayed analytics project.